This is the fifth post in a series on building business process automation at scale. Infrastructure. Automation. Where automation fails. Statistical validation. This time: what happens when two models look at the same data and tell you different things.
In the last post we ran logistic regression on 585,000 bid records and got clean answers. Gender drives win rate. The new design improves conversion in most segments. Two segments are outliers. Ship selectively. Done.
Then we ran neural networks on the same data. And the story changed.
Same Data, Different Answers
The logistic regression simplified the win model down to one predictor: gender. Everything else — age, location, test group, every interaction — got removed because it wasn't statistically significant. Clean, interpretable, explainable.
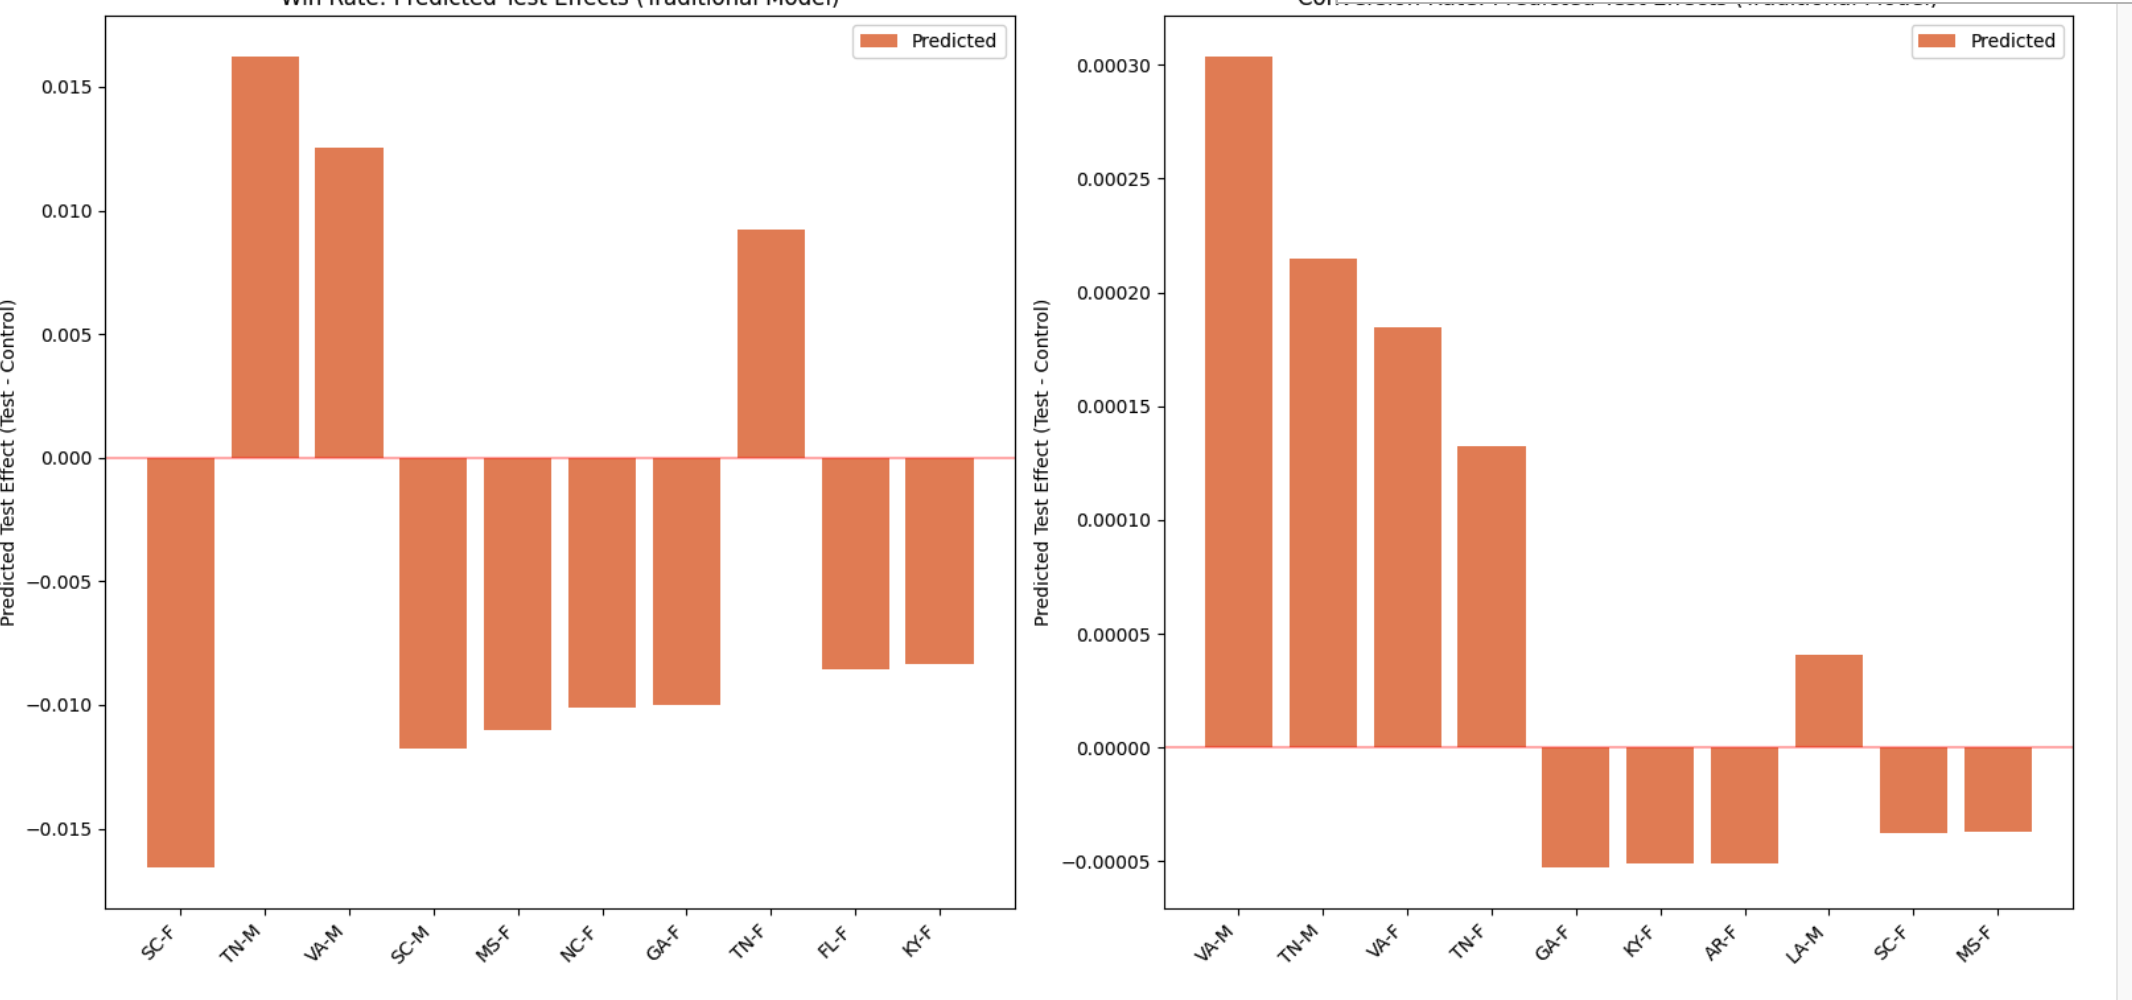
The neural network looked at the same data and found location×gender interactions the logistic regression threw away:
| Location | Gender | Effect |
|---|---|---|
| SC | F | −0.017 |
| TN | M | +0.016 |
| VA | M | +0.013 |
| SC | M | −0.012 |
| MS | F | −0.011 |
Are those real? Or is the network finding patterns in noise that the logistic regression correctly dismissed?
That's not a rhetorical question. It's the core problem.
The Architectures
We built three neural network designs — think of them as different-sized filters for finding patterns in the data. A simple one for a fair comparison with the stats approach, and two specialized ones for each prediction task.
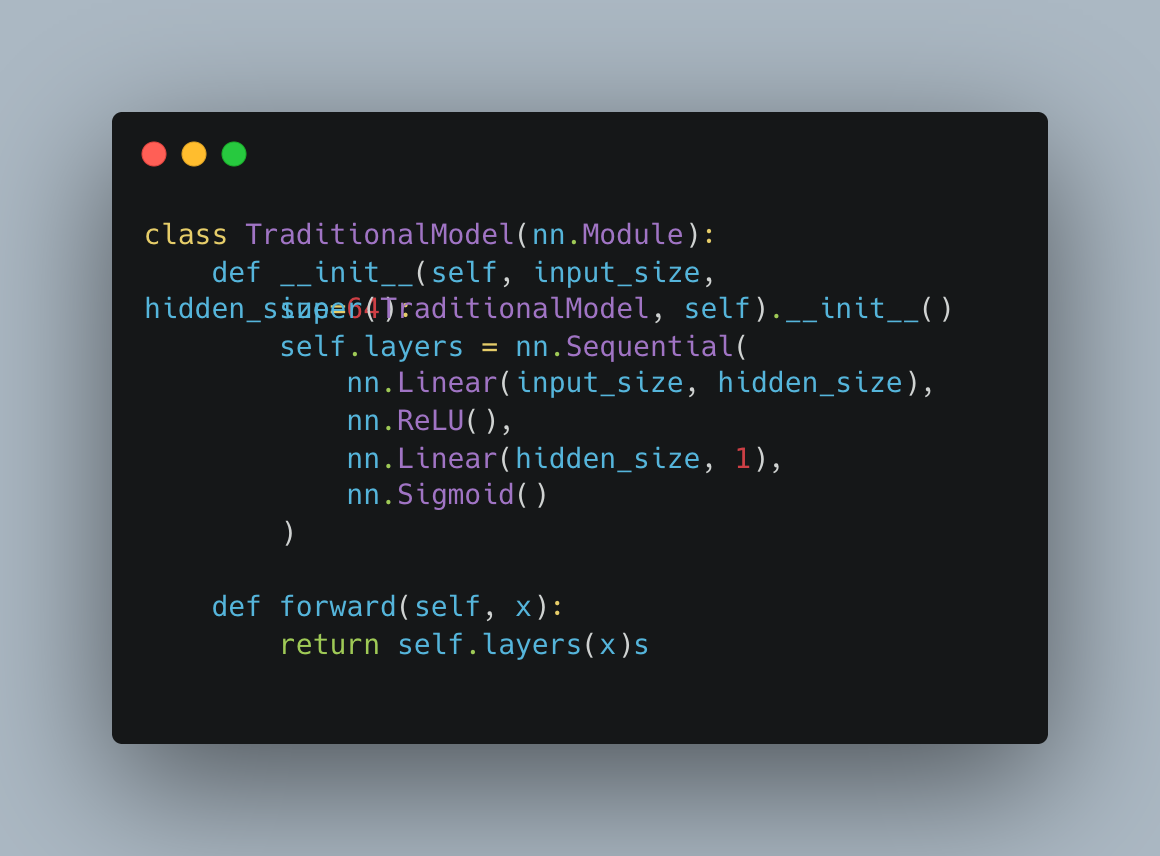
Traditional comparison — a simple design with one layer. Fair baseline against the logistic regression.
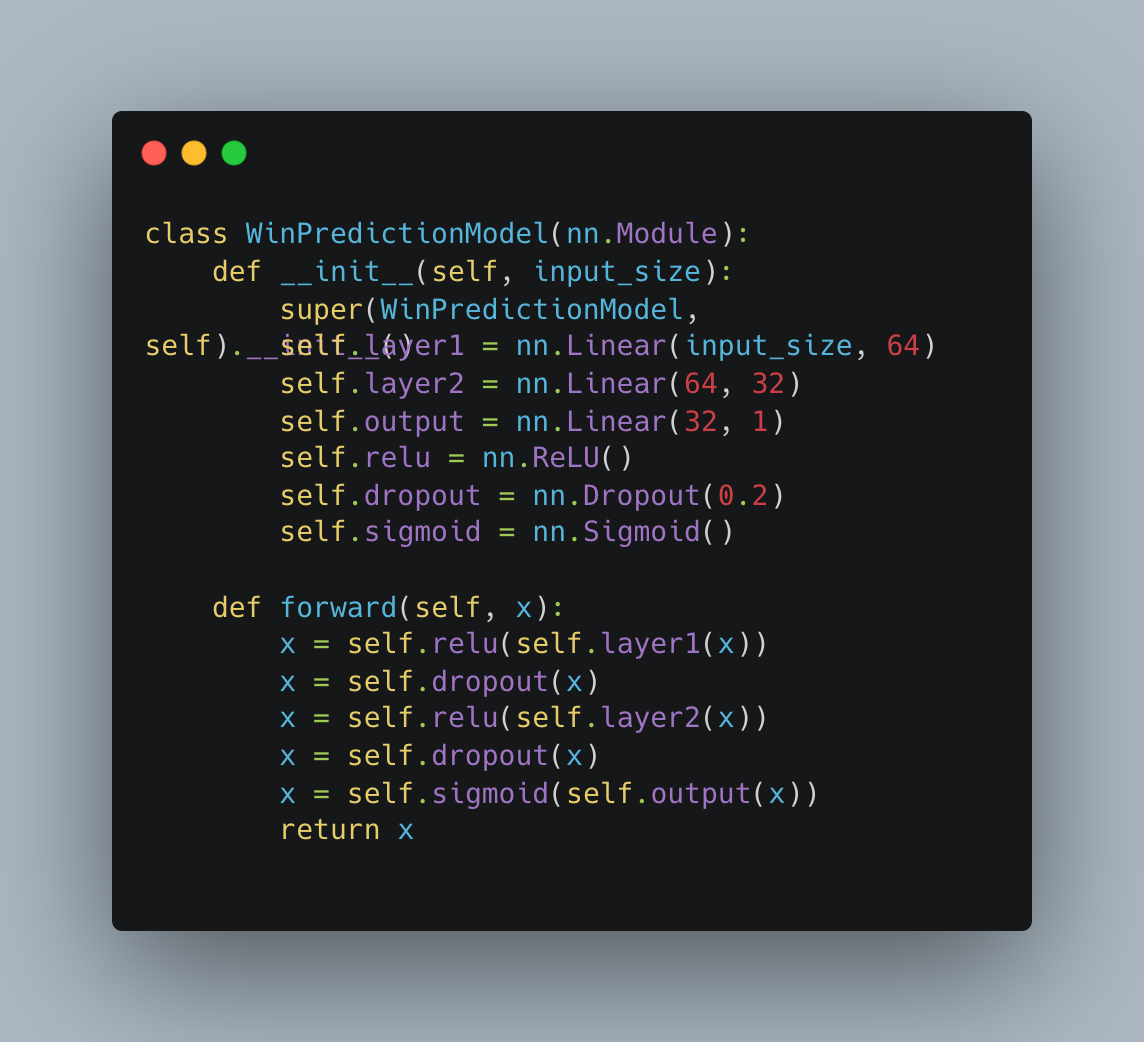
Win prediction — a deeper design with two layers and built-in safeguards against memorizing the training data instead of learning real patterns.
Conversion prediction — a wider single layer with stronger safeguards, because conversion data is heavily lopsided (99% of users don't convert).
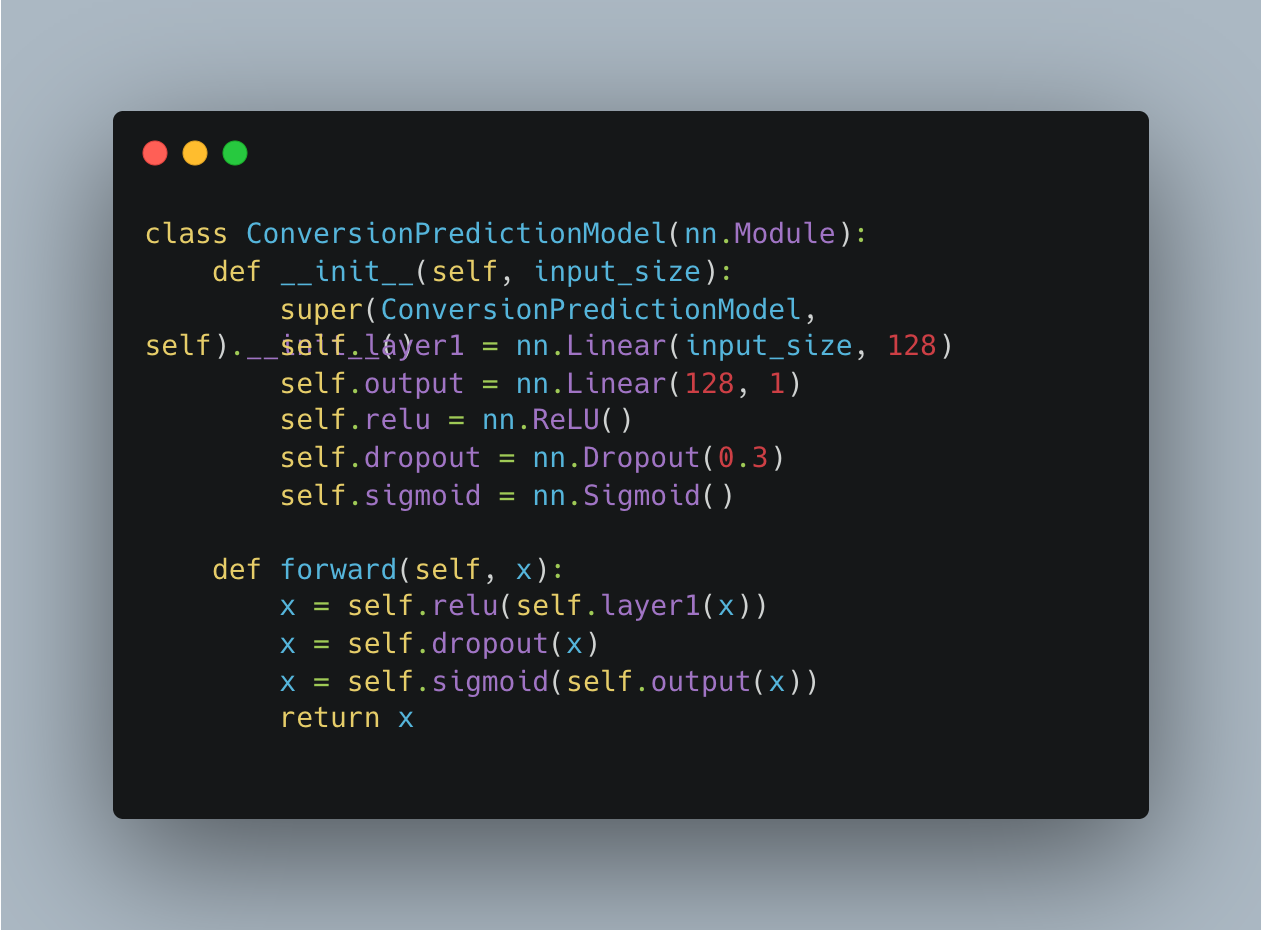
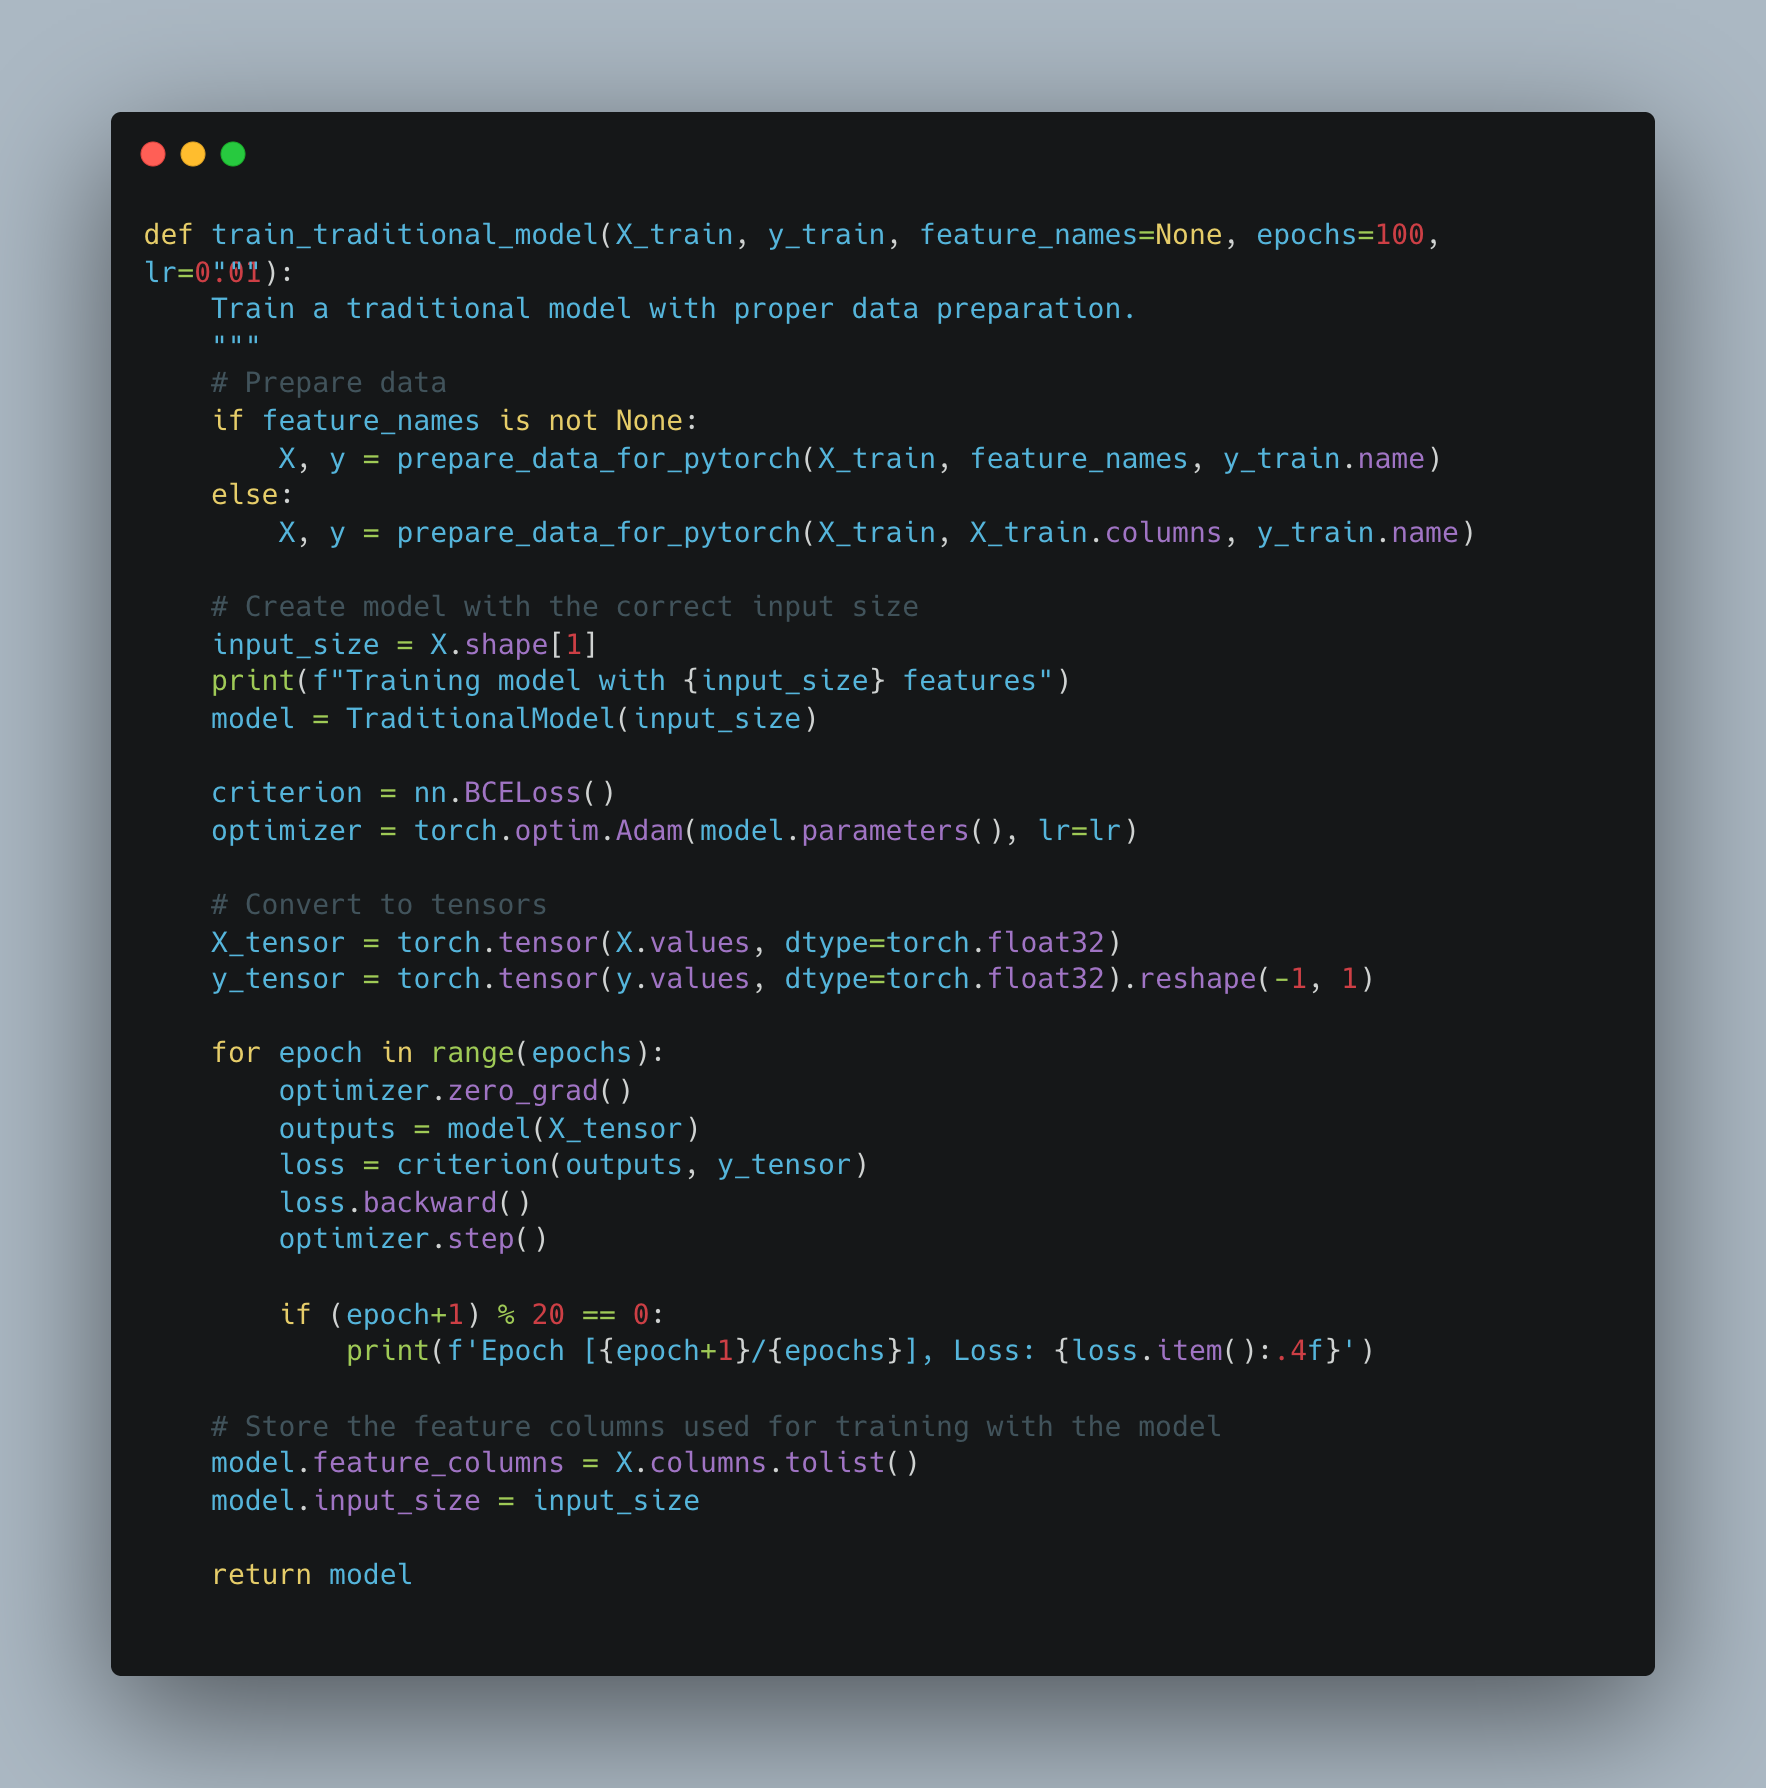
The code below shows how these models get trained — feeding the data through in rounds, measuring how wrong the model is each time, and adjusting until it stops improving:
We tried six different configurations for each task. The key number is R² — it measures how well the model explains the data. 1.0 means perfect, 0.0 means useless.
| Architecture | Win R² | Conversion R² |
|---|---|---|
| [32] | 0.974 | 0.258 |
| [64] | 0.966 | 0.633 |
| [128] | 0.959 | 0.591 |
| [64, 32] | 0.950 | 0.365 |
| [128, 64] | 0.952 | 0.665 |
| [128, 64, 32] | 0.957 | 0.325 |
Win prediction sits above R² 0.95 regardless of architecture — the signal is strong and every configuration finds it. Conversion prediction is a different story: R² ranges from 0.26 to 0.67, with the complex architectures running all 100 epochs without early stopping and still overfitting. Winning bids is predictable. Converting users is not — the signal isn't fully in the data.
Where the Stories Diverge
The logistic regression said: gender drives wins, the new design improves conversion in most segments, done.
The neural network said: actually, the features that matter shift between the test and control groups.
These charts show which inputs the model relies on most. The taller the bar, the more that factor matters for the prediction. Notice how the bars shift between the control group (old design) and the test group (new design):
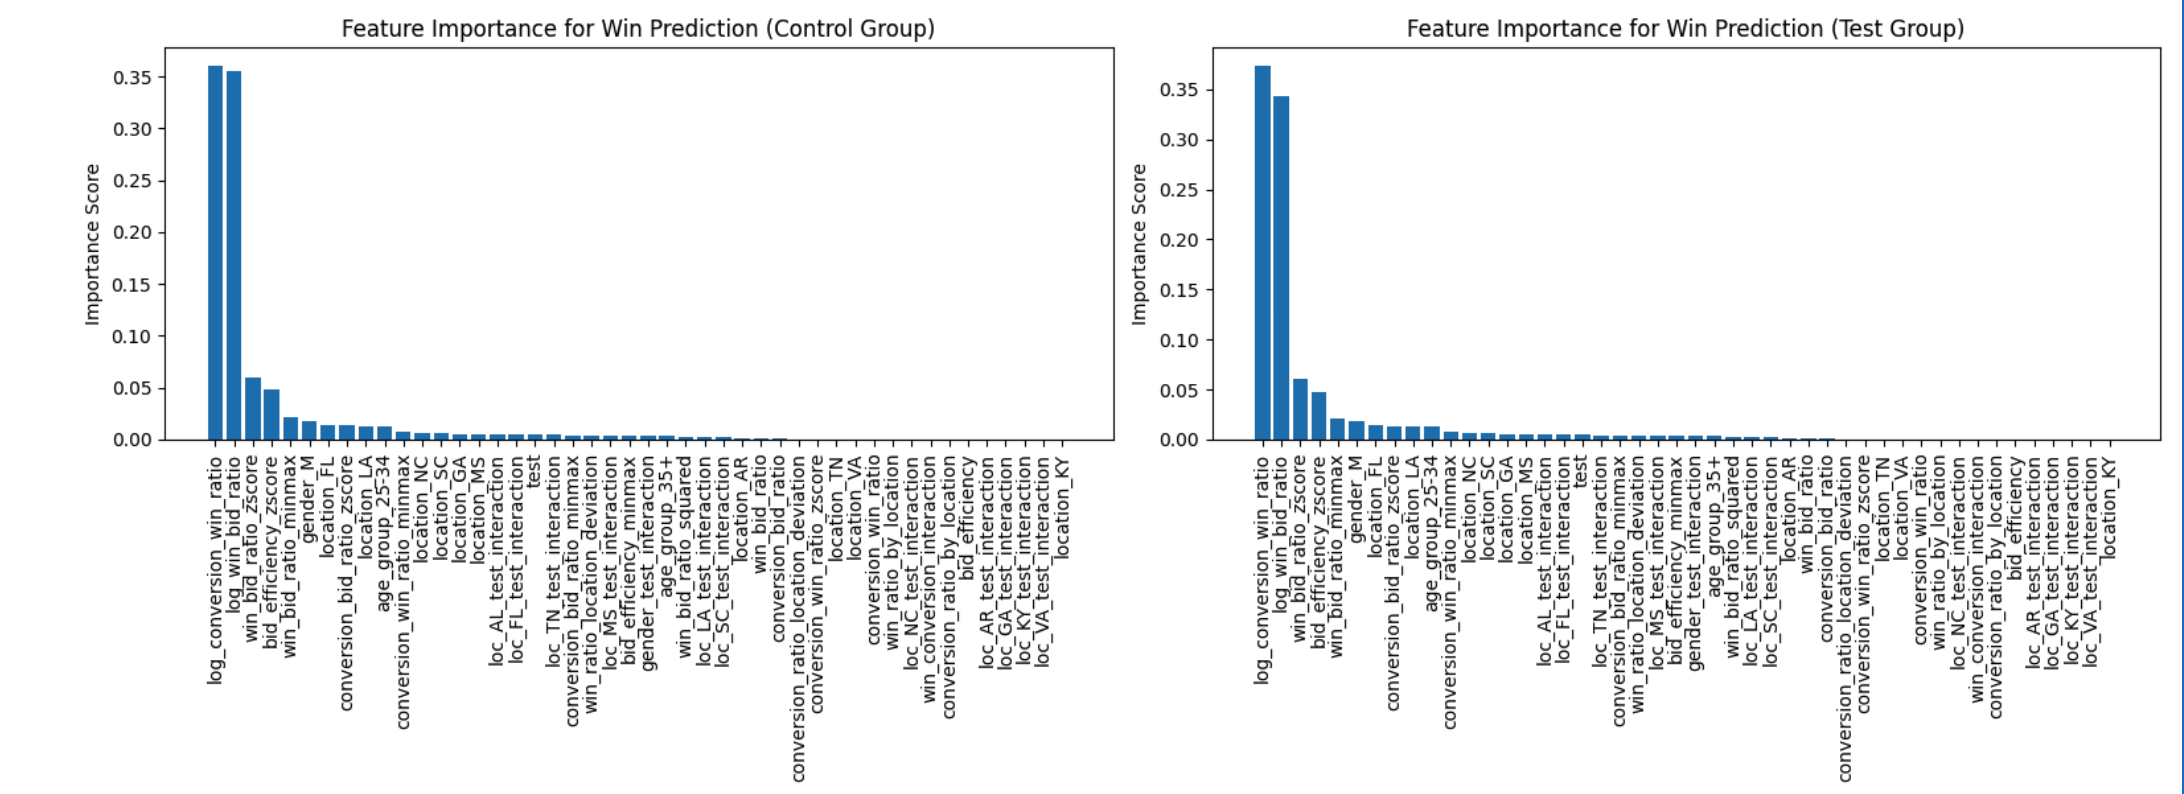
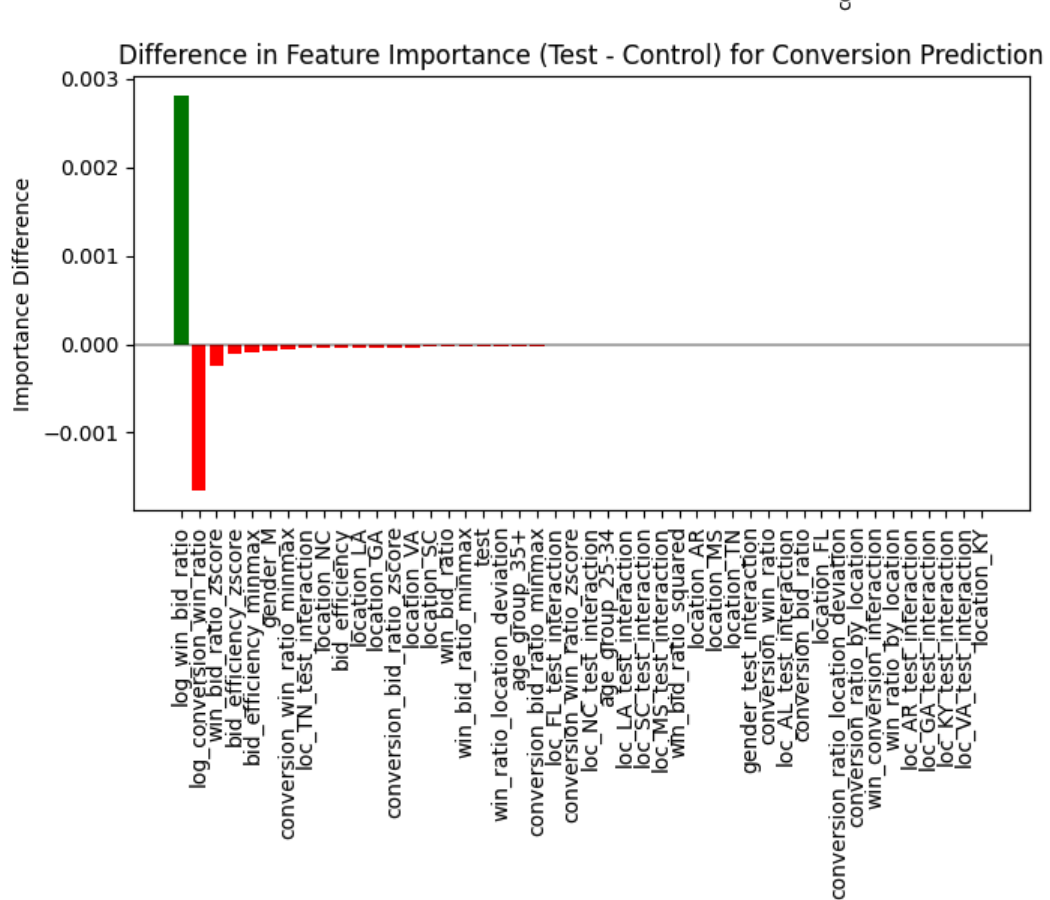
This chart makes the shift clearer — green bars gained importance with the new design, red bars lost importance:
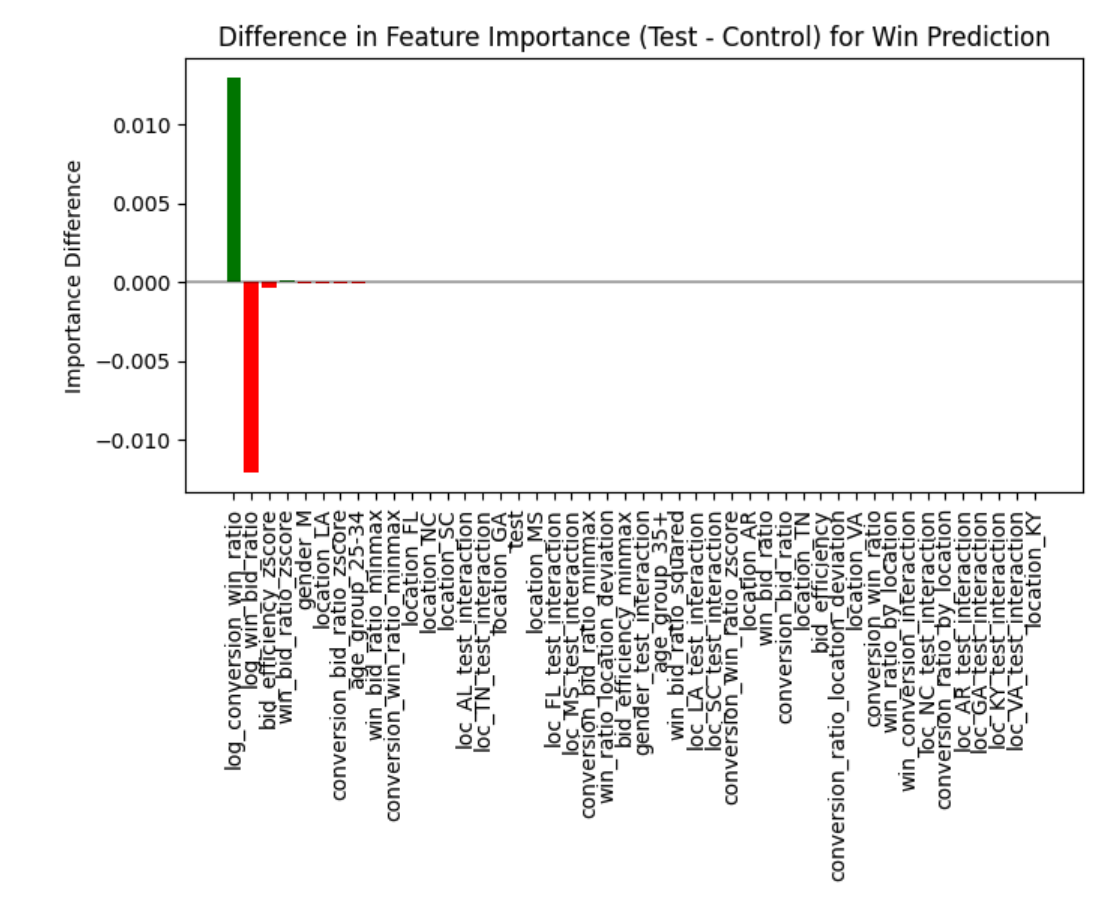
The big finding: the ratio of conversions-to-wins gained importance while the ratio of wins-to-bids lost importance in the test group. In plain English: the new design changed which factors mattered most for winning bids. It didn't just perform differently — it changed the game.
This chart shows the predicted effect of the new design broken out by state and gender — bars above zero mean the new design helped, bars below zero mean it hurt:
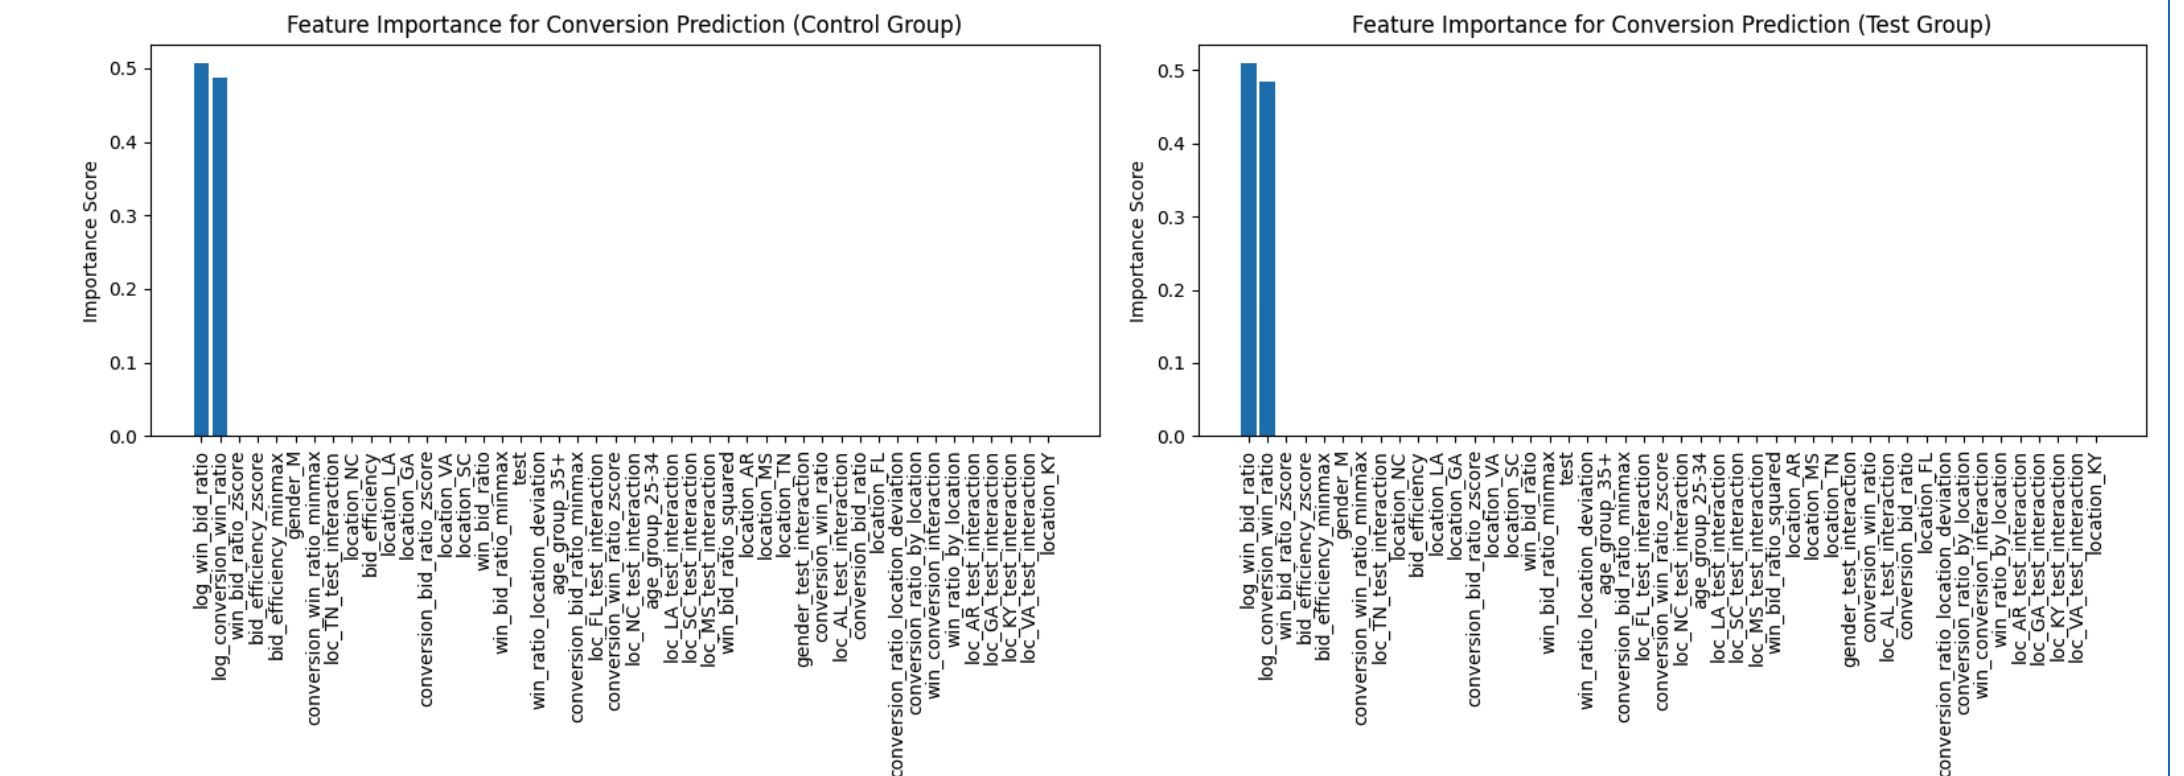
For conversion, the importance shift flipped — the factors that gained importance for wins lost importance for conversions, and vice versa:
The logistic regression couldn't surface this. It tells you what is significant. It doesn't tell you that the significance structure itself changed between groups.
So now you have two stories:
- Stats story: the new design converts better in most segments. Ship it selectively.
- ML story: the new design changed the conversion funnel itself. The relationship between winning a bid and converting shifted. The drivers are different now. The old model of how conversions work may not apply.
Which one do you believe?
The Trust Problem
This is the question nobody wants to answer. Two models. Same data. Different conclusions. The logistic regression is interpretable — you can show the coefficients to a stakeholder and explain exactly what's happening. The neural network finds patterns the regression missed — but those patterns might be noise, and you can't fully explain them.
This isn't just an ad tech problem. This is the fundamental problem with every model-driven decision.
In the 80% Problem post, I described a vision model that picks "Shop Now" instead of "Careers" — with full confidence. The DOM scoring rules say there's no careers page. The LLM says it found one. Which do you believe? That's why _validate_llm_pick exists — a deterministic gate on a non-deterministic output. You build a trust layer between the model and the decision.
Same thing here. The logistic regression is the deterministic gate. It gives you clean, interpretable, defensible answers. The neural network is the pattern detector — it surfaces things the regression can't see, but it also surfaces things that might not be real.
The answer isn't picking one over the other. The answer is knowing what each one is good at and when to trust which:
- Stats when you need to prove something to a stakeholder, pass a significance test, or make a defensible decision. It tells you what's real at a given confidence level.
- ML when you need to explore what's driving outcomes, find interactions you didn't model, or detect shifts in feature relationships. It tells you what to investigate.
- Neither when you need to decide whether it's worth doing. That's a business decision, not a model output.
The Scale Problem
Every effect in this analysis was statistically significant at p < 0.00001. With 585,000 records, everything clears the significance bar. The conversion effects from the neural network are in the 0.0001-0.0003 range. Statistically significant? Yes. But the effect sizes are tiny.
This is the same problem at every scale. The KYB engine processes 1,900 companies a day. At that volume, a 5% error rate produces 95 wrong results daily. The neural network finds interactions across 585,000 bid records that may or may not matter in practice. More data doesn't solve the trust problem — it amplifies it. You get more signal and more noise, and the models disagree about which is which.
At scale, statistical significance is free. Business significance is expensive. The question is never "does the model find a pattern?" — it always does. The question is "should I act on it?"
The Series So Far
Five posts. One argument.
- The Sovereign Stack — own your infrastructure. Cut infrastructure costs by an order of magnitude.
- Know Your Business — build automation that processes at scale. Reduce per-unit research from hours to seconds.
- The 80% Problem — automation has a ceiling. Same 80-90% rule across industries. Speed without accuracy is just making mistakes faster. Design the handoff so humans only touch what machines can't.
- When the Numbers Lie — measure it. Segment your results. The aggregate lies. Know exactly where your system works and where it doesn't.
- This post — two models, same data, different stories. The trust problem is the same whether you're running logistic regression, neural networks, or AI agents. Proving something works isn't the same as knowing which answer to believe.
Deterministic rules, statistical validation, and machine learning aren't competing approaches. They're layers. Rules handle the clear cases. Stats tell you what's significant. ML tells you what's driving it. And when they disagree — that's when you need the human.
That's been the point all along. But "use the human" isn't an answer — it's a cop-out. In the next post, I'll get into what you actually do when models disagree: the triage framework, and why the gap between general patterns and your specific business is where every model fails.
Get in touch if you're navigating the same questions.